New uses of smart meter data are coming to utilities

It is that time again. FERC just published a paper that has been on my night stand every year at this time since 2006: the Assessment of Demand Response and Advanced Metering. The original economic justification for smart meters was tangible—reducing the cost of truck rolls. By their own admission, utilities were slow to understand what to do with smart meter data. Over the last several years, there has been a lot of work done on how analytics, applied to smarter meter and other data, can provide additional value. There is still more to learn.
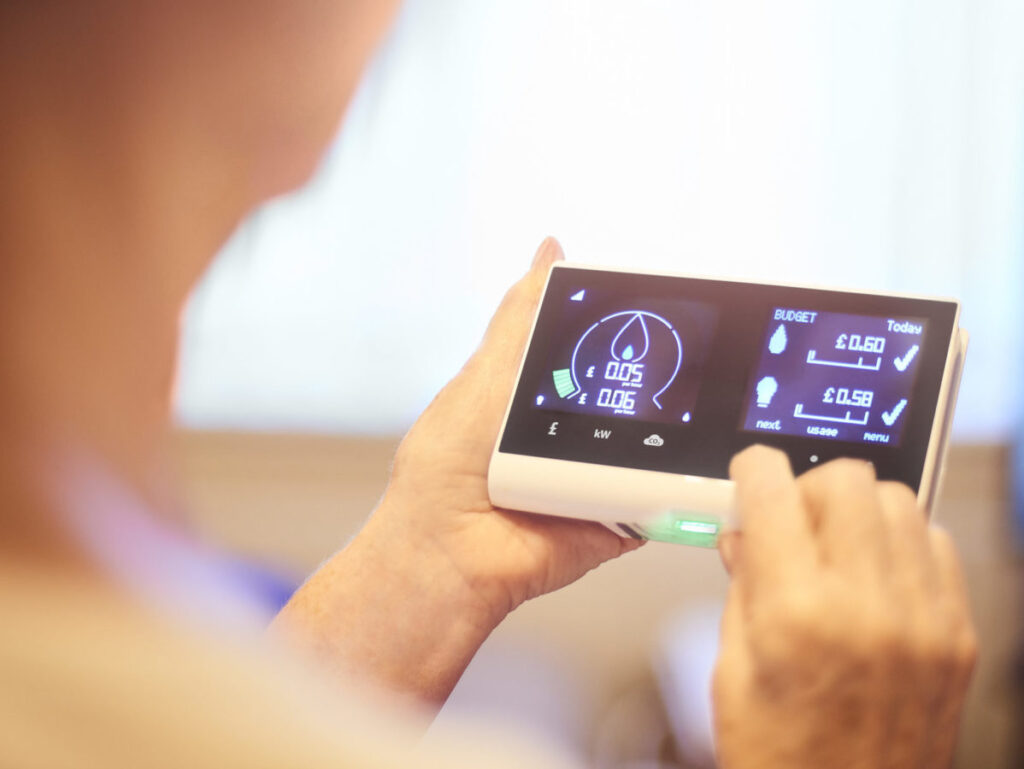
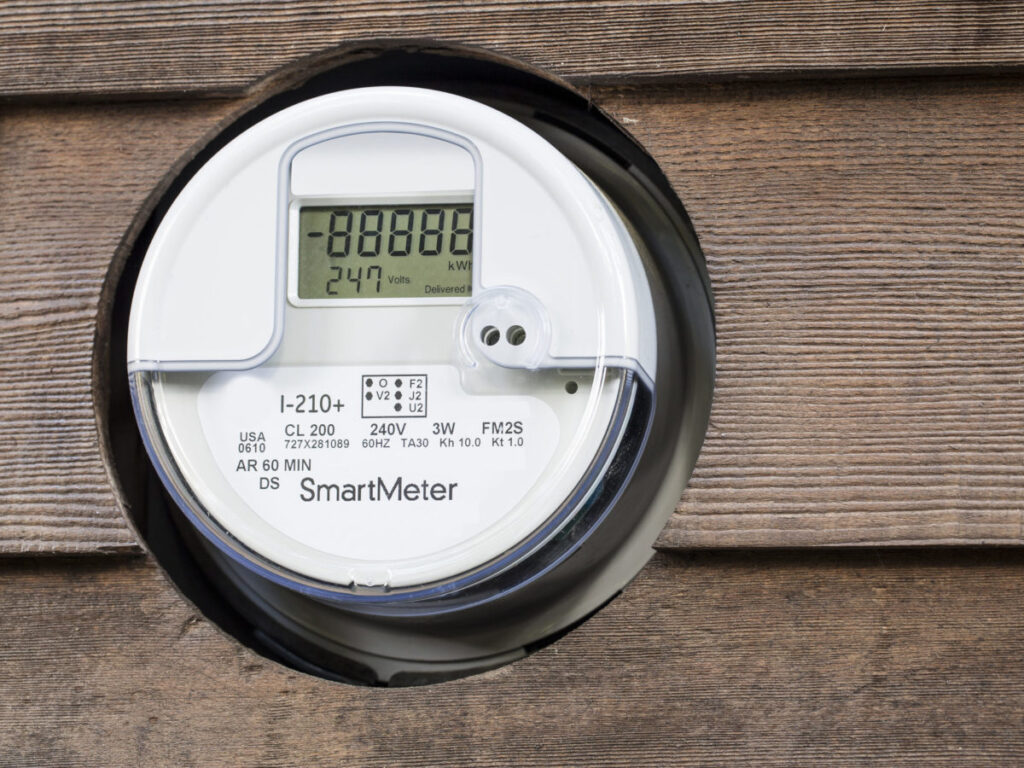
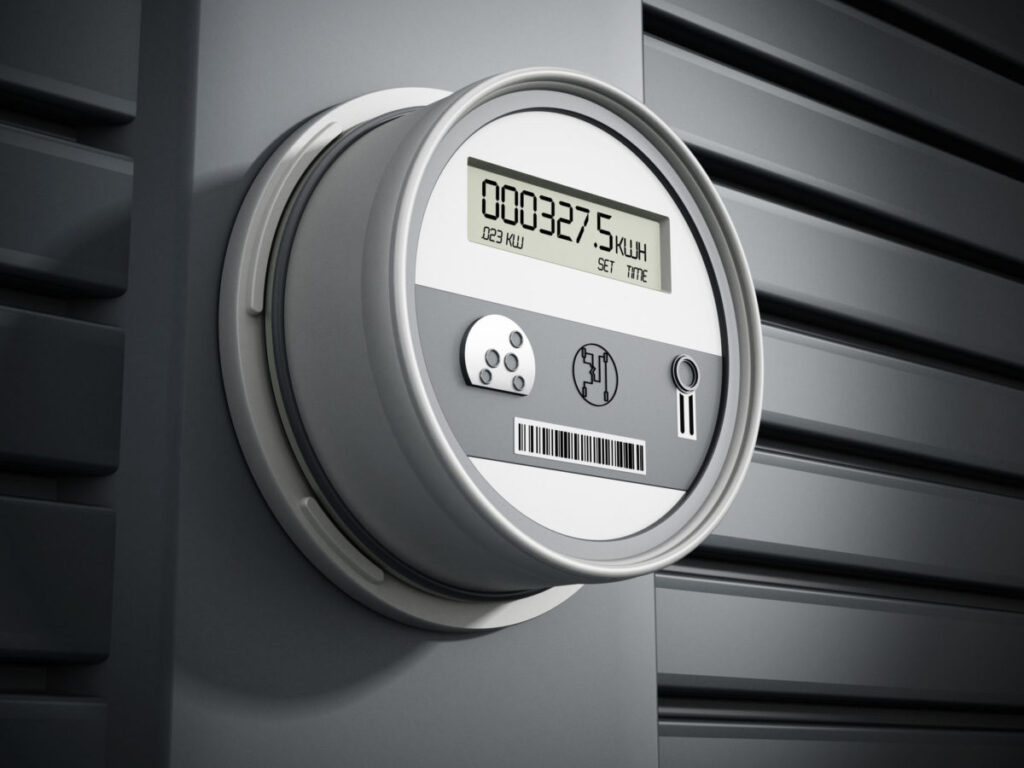
In most places, “smart meters” have become a household word. According to the FERC report, close to half of all meters (46.8%) deployed in the United States are smart meters, and new deployments are in the mix for utilities in North Carolina, New York, Florida, Hawaii, and Rhode Island.
Veterans of smart meter deployments have lessons that these newcomers can learn. Utilities have had measurable success using analytics to improve performance in operations and customer engagement. Analytics are being used on top of smart meter data to detect fraud, reduce outage restoration times, adjust transformer loading, enhance system planning, improve safety records, optimize crew dispatch, target energy efficiency marketing, address high bill complaints and predict storm damage.
As utilities grow in analytics maturity and new situations arise, there will be other use cases for analyzing smart meter data. Here are some that you may not know about:
- Shifting demand. In a recent paper by Lawrence Berkeley Labs, researchers used hourly smart meter data of 200,000 customers to understand how load shifting programs could have a system-wide impact on eliminating the classic California Duck Curve.
- TOU mandate. Another case of shifting demand is a utility preparing for a Time-Of-Use rate regulatory mandate. Smart meter data is being analyzed to help the planning team understand which customers would be winners, losers or losers that could be turned into winners in various rate scenarios.
- Power quality. PSEG is proposing the use of smart meter voltage data, aggregated to the distribution transformer, to determine locations with voltage violations and identify locations for deployment of Volt/VAR optimization equipment.
- Identifying hazards. Broken neutrals in the low voltage systems pose personal safety hazards and may cause damage to behind-the-meter appliances. European utility Vattenfall has a project to develop an algorithm, when used in conjunction with smart meter data, that can identify broken neutrals and other potential low voltage faults.
Social media and search engines have brought advances in Artificial intelligence (AI) and machine learning (ML). New tools will make it easier to extract value from smart meter data (For those of you wanting a quick and dirty primer on AI see What is AI? We drew you a flowchart to work it out and for ML see What is machine learning? We drew you another flowchart).
In the example above, Vattenfall is using supervised and unsupervised machine learning methods to quickly find patterns that can train neural networks. The unsupervised piece is interesting because it looks at whatever patterns it can find without being told where to look. That opens the possibility to find out what “we don’t know” from smart meter data.
When this exercise is done by teams of business managers and data scientists—think agile development—the results can be instructive. According to one utility leader, “in the traditional way of doing things, the business defines the requirements and IT delivers the solution. But the business doesn’t know what they don’t know. That’s why an Agile approach is a good one. They know it when they see it.”


