The Role of Advanced Analytics in Optimizing ROI of Projects to Improve Day-to-Day Outage Management Response

Utility planners can drive big ROIs by using more detailed data to reveal the best area for improvement when it comes to responding to smaller day-to-day outages. A review of a wide range of recent OMS-related improvements clearly shows that utility planners are in a position to optimize planning for future improvements in more targeted ways than ever before. Such planning efforts can include analysis of historical outage responses alongside ever-more-detailed internal operational and customer information system data.

Major vs. minor outages
In its April 5, 2018 posting, “Average frequency and duration of electric distribution outages vary by states” the U.S. Energy Information Administration (EIA) reported that in 2016, customers experienced an average of 1.3 interruptions and went without power for four hours during the year. Obviously, minor electrical outages on the distribution system are much more numerous than major outages in terms of number of events, but major outages get a lot more attention, and rightfully so. However, significant concern is still placed on minor outages, and improvements are a major area of value that is sought by utilities.
A look back at the “olden days” of outages
The utility industry has come a long way in how it handles outages. In the “olden days,” a “look at the map sideways” process was employed at most electric utilities when addressing outages.
Basically, when calls came in reporting electric service outages, a piece of paper (a.k.a. an “outage ticket”) would be written up and placed upon a big service territory map on a table. A way of prioritizing outages based on size and impact was to take a sideways look at the table, to see where the tallest stack of outage tickets sat.
Looking at small outages today
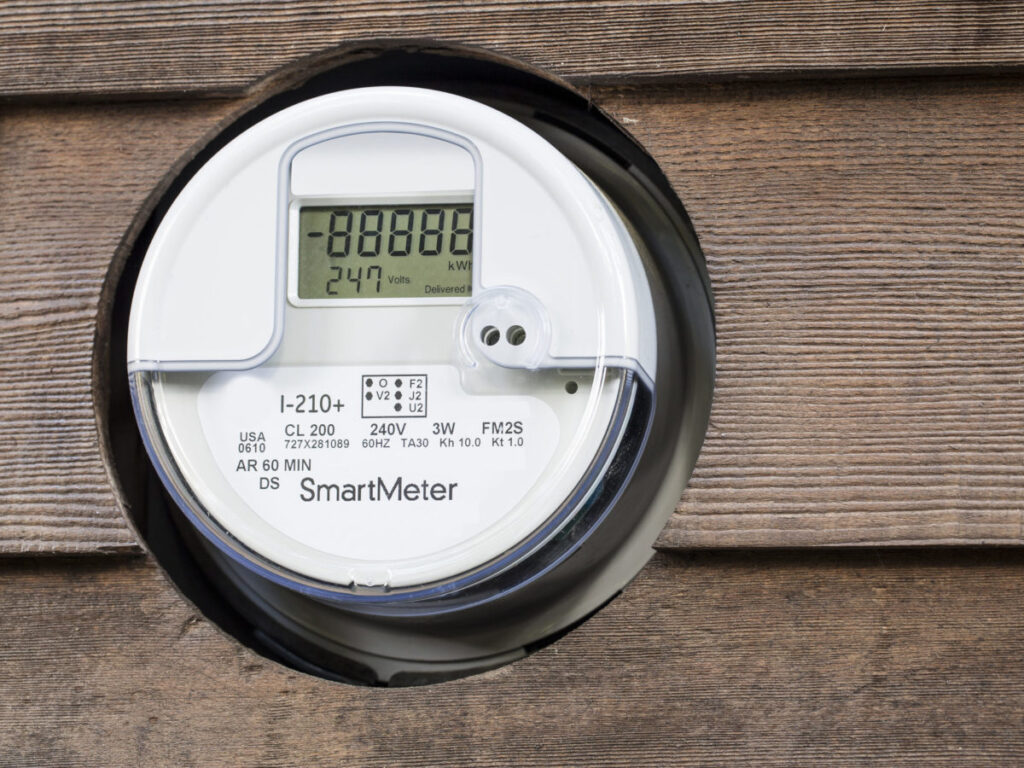
Nowadays, full-fledged Outage Management Systems (OMS) utilize sophisticated models based on real-time analysis of outage data to determine where to dispatch crews to restore power at the most critical node in the electric networks. And in many cases, utilities employ outage reporting solutions which indicate the location(s) and extent of loss of service enabled by last-gasp data from smart meters.
While much has been written in recent years about investments in T&D upgrades for storm hardening and about improvements in the ability to respond to major outages, advanced analytics is driving massive value by optimizing capabilities to manage small outages.
Beyond improvements to the Outage Management Solution (OMS) itself, a significant number of utilities are improving their ability to respond to small-scale outages by analyzing and optimizing a host of related workflows.
Given the depth of historical O&M and outage data available to the typical utility nowadays, analytics-driven prioritization of target areas for improvement plays a role in the planning process. For example, in a recent report provided by Exelon, it is stated that its subsidiary PECO “Continues to experience significant benefits to outage restoration, interruption frequency and interruption duration metrics resulting from smart metering. Outage benefits were achieved by using the system to avoid more than 10,000 outage response truck rolls. (Page 38, Exelon CSR.)
How do utility planners and Operations personnel prioritize their options for outage management system improvements, and/or improvements to related processes? Utilities perform various highly detailed ROI benefits analyses to justify such decisions. After a comprehensive review of recent utility projects and related white papers, these “adjacent” solutions coalesce around key over-arching functional areas, as well as related solutions:
Functional areas
- Customer workflows
- Data / Analytics
- Field Operations
- Modeling / Visualization
- Network Communications
Solutions
- Advanced Metering Infrastructure (AMI)
- Customer Information Systems (CIS)
- Distribution Automation (DA)
- Data Warehouses
- Digital Dashboards and Enterprise Portals
- Distribution Management System (DMS)
- Embedded data management solutions
- Enterprise Asset Management (EAM)
- Fault Monitoring
- Meter Data Management Systems (MDMS)
- Mobile Workforce Management (MWFM)
- Network Modeling solutions
- Geospatial Information Systems (GIS)
- Supervisory Control and Data Acquisition (SCADA)
- Web portals
The “main” improvement area involves SCADA upgrades (which is the workhorse for gathering data from equipment in the grid). In a recent T&D World article about a midwestern electric cooperative, their SCADA upgrade reportedly enabled staff to “be notified of these power-quality situations and mitigate the problems before they escalate to outages” (see this link from “MiEnergy Invests in SCADA,” T&D World, January 2018).
If you look at how OMS were utilized in the past, as recently as 10-15 years ago, detailed job-by-job tracking of costs and materials (e.g. spools of cable and truck rolls), was rarely performed. In more recent years, the cost of tracking details associated with restoration work has come down substantially, increasing the amount of data that can be used as a resource for performance analysis.
Perhaps the most powerful benefit of the analytics is the ability to predictively manage outages before they occur. Before investing in improvements of one or another “adjacent to OMS” area, there is a new ability for utility analysts and planners to determine root causes of areas where performance in day-to-day outage response was poor and determine key areas in the value chain where the greatest possible return on investment for improvement can be enjoyed.
Here is a sampling of recent Utility Analytics Institute and Transmission & Distribution World coverage showing the range of projects involved.
- Oncor’s top three use cases for advanced analytics all had strong ties to OMS: 1) Estimated Time of Restoration (ETR) for outages based on real-time operational data; 2) Developing a meter-based connectivity model, and 3) A forward-looking data model that can provide power flow estimates for any point on the distribution grid. (See Utility Analytics Institute Feb 2018 Analytics Insights piece “Oncor’s Journey to An Advanced Distribution Grid.”
- Dayton Power & Light’s improvement to the outage mapping interface made available to the utility customer (e.g. see the January, 2018 T&D World article “Dayton Power and Light Launches an Improved Outage Map”).
- Central Georgia EMC to improve its analytics capabilities “A Data-Driven Utility” (TDW 2/2018)
- Hawaiian Electric to expand voltage management tools, enhance its Outage Management / notification and selectively deploy advanced meters (“Hawaiian Electric Companies Get Go-Ahead on Grid Modernization Plans” TDW 2/2018)
- Baltimore Gas & Electric to get tens of thousands of its customers to sign up for a new mobile app: (see “BGE Launches New Mobile App” TDW 2/2018)
- A southeastern electric cooperative chose to upgrade OMS-related analytical capabilities (see AMI solution upgrades.)
- Or “outage ecosystem” related predictive analytics improvements (e.g. Cognizant’s “Smart Power Outage Communications,” 3/2018 TDW)
- Or Wisconsin Public Service to add ability to remotely connect customers and to improve outage management support with an AMI and MDMS upgrade (per “Wisconsin Public Service to Deploy Landis+Gyr AMI Network Platform,” TDW, January 2018).
- Simultaneous SCADA and OMS installation or upgrade (e.g. per two recent examples: The T&D World piece on January, 2018 “GRU Selects Outage Management System,” and the December 2017 T&D World piece “Mid-Ohio Energy Achieves 64% Reduction in SAIDI.”) Or, an OMS upgrade done co-currently with an ADMS upgrade and another vendor’s MWFM integration (see the January 2018 TDW piece “FortisBC Modernizes Outage Management System.”)


